
Arcadia Bluffs Golf Club: 3D flyover
18 holes on real terrain. The ground is the USGS 3D Elevation Program's 1-metre lidar surface; the picture on top of it is USDA NAIP orthoimagery; the hole centrelines, greens and tees come from OpenStreetMap. Nothing was flown, staged or drawn by hand. This is public data, rendered.
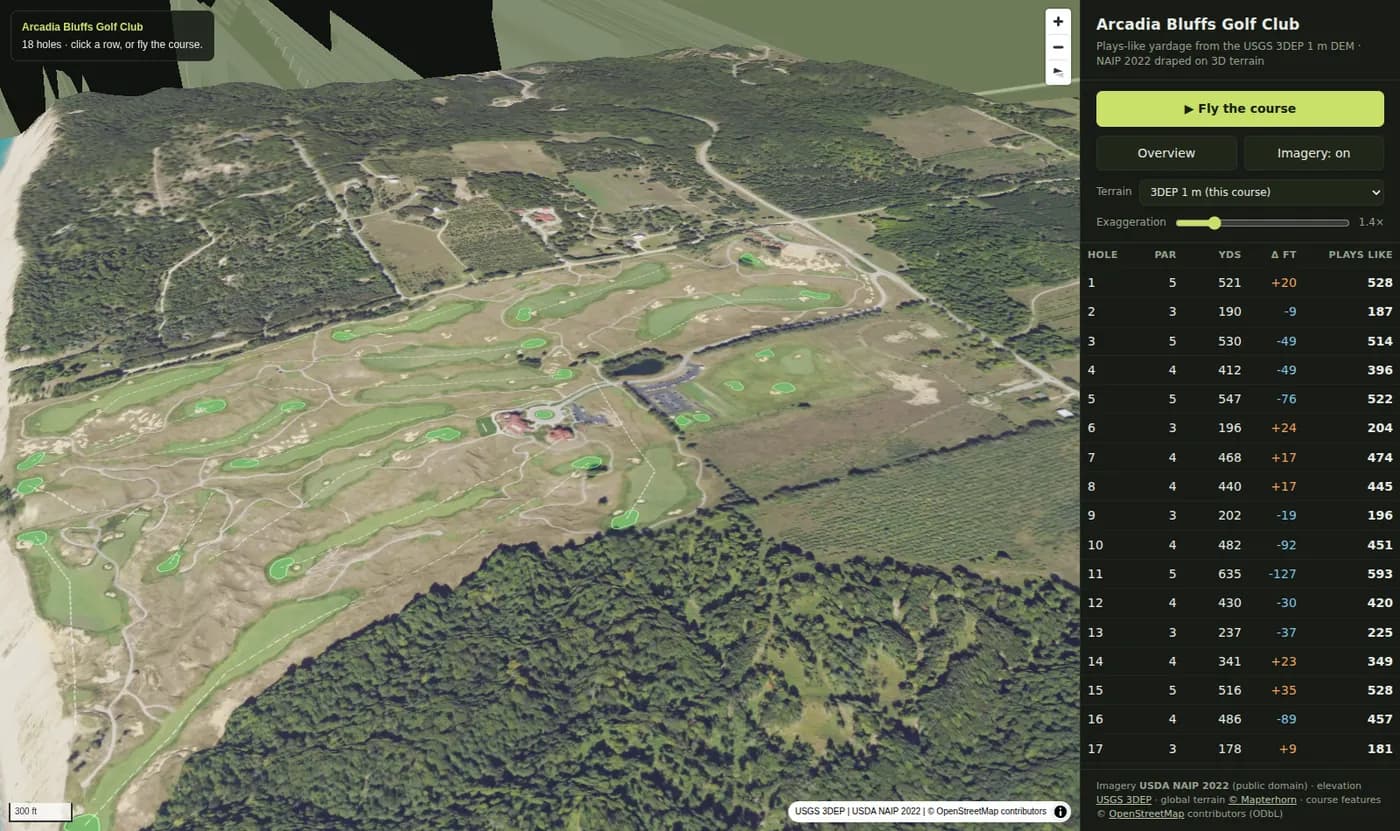
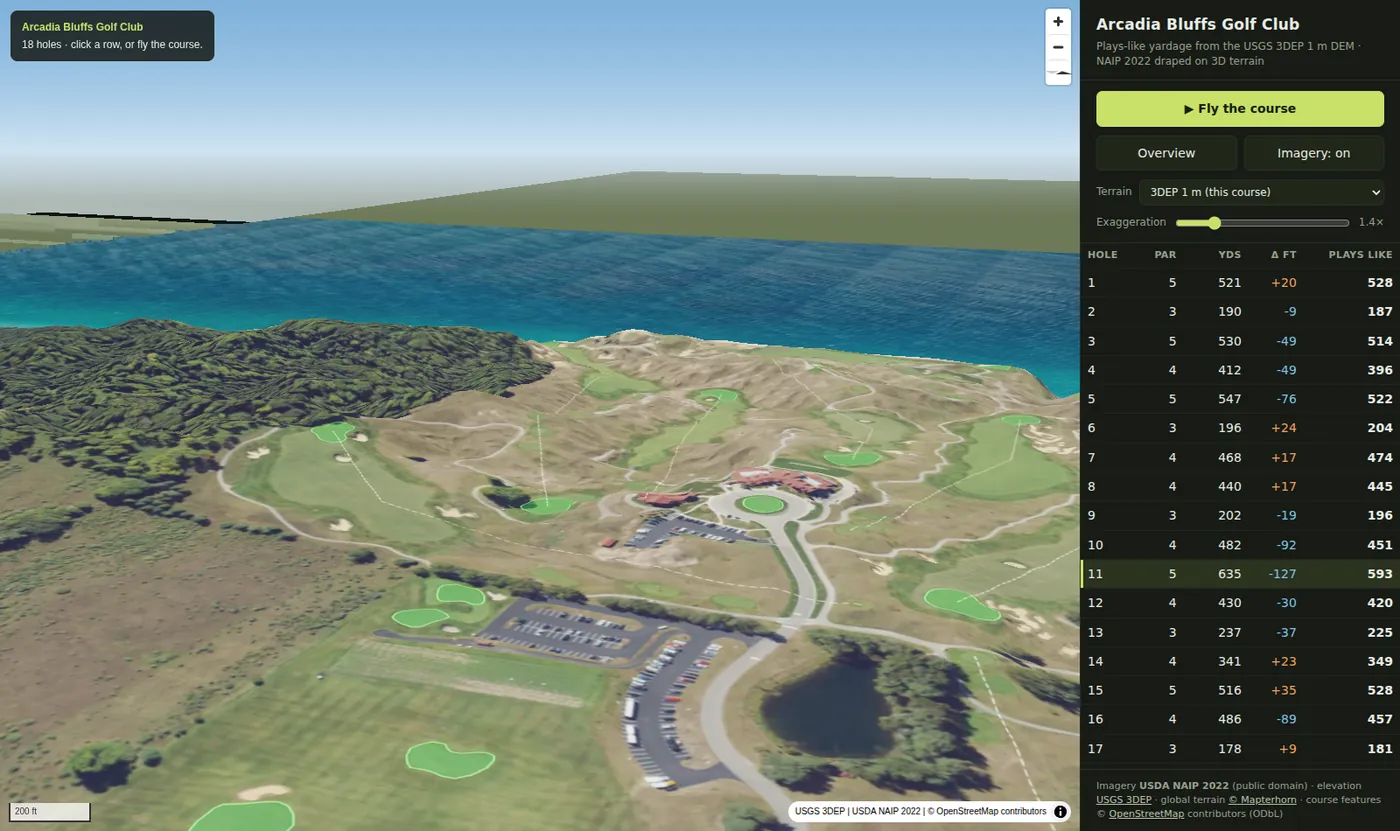
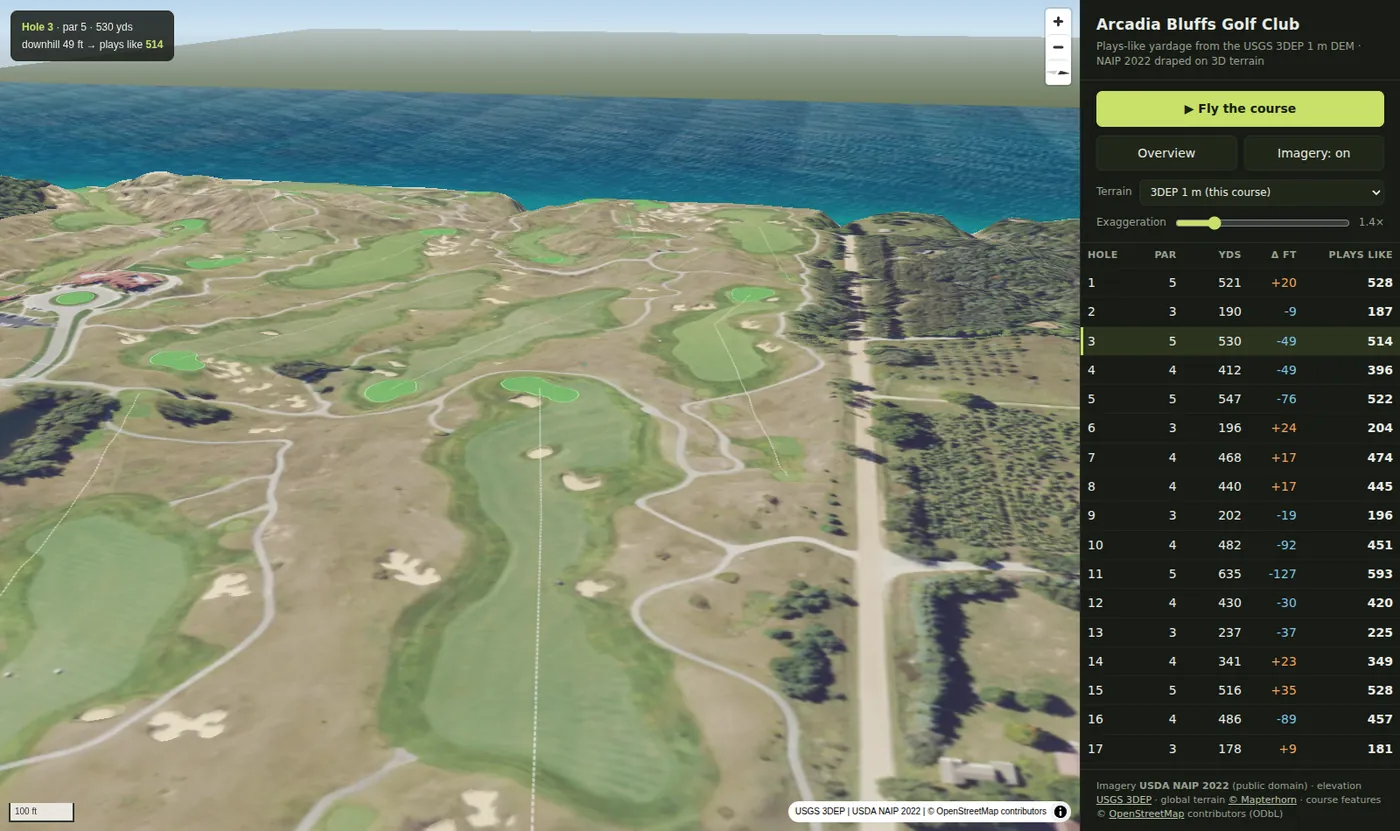
These are frames, not the flyover. The interactive viewer is built and runs; its terrain and imagery tiles are not hosted publicly yet, so this page shows stills captured from it rather than an empty map. The measurements below are unaffected: they come from the elevation model, not from the map.
Every hole, tee to green
Elevation is the 1 m surface sampled at the tee and green centroids. Plays like adds one yard of playing distance for each yard of elevation change.
| Hole | Par | Yards | Tee ft | Green ft | Δ ft | Plays like |
|---|---|---|---|---|---|---|
| 1 | 5 | 521 | 831 | 851 | +20 | 528 |
| 2 | 3 | 190 | 873 | 864 | −9 | 187 |
| 3 | 5 | 530 | 892 | 844 | −49 | 514 |
| 4 | 4 | 412 | 843 | 794 | −49 | 396 |
| 5 | 5 | 547 | 792 | 716 | −76 | 522 |
| 6 | 3 | 196 | 731 | 755 | +24 | 204 |
| 7 | 4 | 468 | 795 | 812 | +17 | 474 |
| 8 | 4 | 440 | 837 | 854 | +17 | 445 |
| 9 | 3 | 202 | 826 | 807 | −19 | 196 |
| 10 | 4 | 481 | 837 | 745 | −92 | 451 |
| 11 | 5 | 635 | 810 | 684 | −127 | 593 |
| 12 | 4 | 430 | 751 | 721 | −30 | 420 |
| 13 | 3 | 237 | 752 | 715 | −37 | 225 |
| 14 | 4 | 341 | 740 | 763 | +23 | 349 |
| 15 | 5 | 516 | 790 | 825 | +35 | 528 |
| 16 | 4 | 486 | 845 | 756 | −89 | 457 |
| 17 | 3 | 178 | 757 | 766 | +9 | 181 |
| 18 | 4 | 435 | 793 | 819 | +26 | 444 |
| Total | 72 | 7,245 | −406 | 7,114 |
The measured yardages sum to 7,245 against the 7,234 on the card, and par sums to 72 against 72. That agreement is the check that the hole matching and the tee-and-green assignment are right. It is not something that can be arranged. The 11th gives up 127 ft from tee to green.
How this is measured, and what it is not
- Elevation
- USGS 3DEP, native 1-metre lidar over this course. The published specification for 1 m data is 10 cm vertical RMSE. Tee and green figures are the surface sampled at each polygon's centroid; the polygon median agrees with it within 3 ft on all 18 holes, so no number here rests on a single pixel.
- Plays-like yardage
- A geometric adjustment only: yards + (green elevation − tee elevation) ÷ 3. It ignores wind, temperature, air density, lie, and the fact that a ball falling to a green lands steeper and stops sooner. It is not a club recommendation.
- Green slope
- Slope percent from the same 1 m surface, per green. The median across the 18 greens is 4.70% over the whole mapped green, and 3.48% once 4 m is eroded off the edge to drop the collar and the fall-offs. Slope is the only quantity measured: no break, no putt lines, no green speed. This is topography, not a green-reading book.
- Imagery
- USDA NAIP, a leaf-on late-summer flight. Tree shadow falls across parts of some greens in the picture. It does not affect the elevation model underneath, which is bare-earth lidar.
This can be built for your course
The same flyover, embeddable on your club's own site, wherever USGS publishes lidar. Pricing and what is involved are on the courses page.
For golf courses →Imagery: USDA NAIP / USGS · Elevation: USGS 3DEP · Course features: © OpenStreetMap contributors (ODbL). Every18 is not affiliated with Arcadia Bluffs Golf Club, and this page is not endorsed by the club.